Difference between revisions of "NumericPython"
Jump to navigation
Jump to search

| Line 42: | Line 42: | ||
plt.show() | plt.show() | ||
</pre> | </pre> | ||
| + | |||
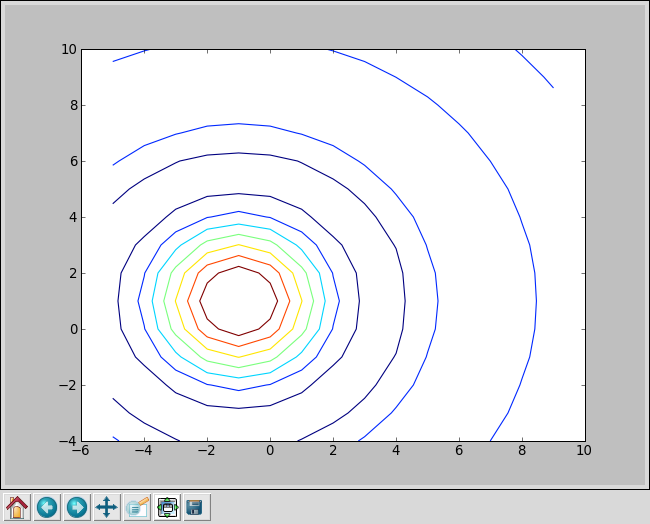
| + | and you should get a window similar to: | ||
| + | |||
| + | [[Image:Sinc-matplotlib-contour.png|frame|none|A grey-scale map of the sinc function]] | ||
Revision as of 14:42, 21 July 2009
Numeric Python: Some handy array tools
Introduction
Getting Started
from Numeric import *
Arrays
More Interesting
x = arange(-5,10)
y = arange(-4,11)
z1 = sqrt(add.outer(x**2,y**2))
Z = sin(z1)/z1
If you have the NumTut package available, then you can simply type:
from NumTut import *
view(Z)
and you should get a window similar to:

A grey-scale map of the sinc function
Otherwise, we can use the matplotlib package:
import matplotlib.pyplot as plt
from pylab import meshgrid
X, Y = meshgrid(x,y)
plt.figure()
plt.contour(X,Y,Z)
plt.show()
and you should get a window similar to:

A grey-scale map of the sinc function