Profiling
Can I speed up my program?
Introduction
Are you in the situation where you wrote a program or script which worked well on a test case but now that you scale up your ambition, your jobs are taking an age to run? If so, then the information below is for you!
Key Questions
Now that we have established that you'd like your jobs to run more quickly, here are the some key questions that you will want to address:
- How long, exactly, does my program take to run?
- Is there anything I can do to speed it up?
- Which parts of my program take up most of the execution time?
- Where should I focus my improvement efforts?
We'll get onto answering these questions in a moment. First, however, it is essential that we go into battle fully informed. The next section outlines some key concepts when thinking about program performance. These will help focus our minds when we go looking for opportunities for a speed-up.
Factors which Impact on Performance
The Memory Hierarchy
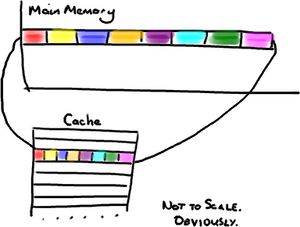
These days, it takes much more time to move some data from main memory to the processor, than it does to perform operations on that data. In order to combat this imbalance, computer designers have created intermediate caches for data between the processor and main memory. Data stored at these staging posts may be accessed much more quickly than that in main memory. However, there is a trade-off, and caches have much less storage capacity than main memory.
An analogy helps us appreciate the relative differences between various storage locations:
| L1 Cache | Picking up a book off your desk (~3s) |
| L2 Cache | Getting up and getting a book off a shelf (~15s) |
| Main Memory | Walking down the corridor to another room (several minutes) |
| Disk | Walking the coastline of Britain (about a year) |
Now, it is clear that a program which is able to find the data it needs in cache will run much faster than one which regularly reads data from main memory (or worse still, disk).
The creation of cache storage reflects the observation that programs often adhere to the principle of Locality of Reference (http://en.wikipedia.org/wiki/Locality_of_reference). We can see two variants of locality:
- Temporal locality - We expect to re-use of data already seen.
- Spatial locality - We expect to access data stored close to data that we've already seen.
We will get the best performance from our programs if we write them in adherence to these two principles whenever possible.
How can we ensure that we make best use of the memory hierarchy?
Starting at the slowest end: Let's suppose you have a data set stored on disk which you want to work on. If that data will all fit into main memory, then it will very likely pay dividends to read all this data at the outset, work on it, and then save out any results to disk at the end. This is especially true if you will access all of the data items more than once or will have a non-contiguous pattern of access.
Ensuring that we make best use of cache is a little more subtle. In order to devise a good strategy, we must appreciate some of the hidden details of the inner workings of a computer: Let's say a program requests to read a single item from memory. First, the computer will look for the item in cache. If the data is not found in cache, it will be fetched from main memory, so as to create a more readily accessible copy. Single items are not fetched, however. Instead chunks of data are copied into cache. The size of this chunk matches the size of a block of storage in cache known as a cache line (often 64 bytes in today's machines). The situation is a little more complex when writing, as we have to ensure that both cache and main memory are synchronised, but--in the interests of brevity--we'll skip over this just now.
The pay-off for this chunked approach is that if the program now requests to read another item from memory, and that item was part of the previous fetch, then it will already be in cache and an slow journey to main memory will be avoided. Thus we can see that re-use of data already in cache will be a key factor in program performance.
A good example of this would be a looping situation. A loop order which predominately cycles over items already in cache will run much faster than one which demands that cache is constantly refreshed. Another point to note is that cache size is limited, so a loop cannot access many large arrays with impunity. Using too many arrays in a single loop will exhaust cache capacity and force evictions and subsequent re-reads of essential items.
Optimising Compilers
Compilers take the (often English-like) source code that we write and convert it into a binary code that can be comprehended by a computer. However, this is no trivial translation. Modern optimising compilers can essentially re-write large chunks of your code, keeping it semantically the same, but in a form which will execute much, much faster (we'll see examples below). To give some examples, they will spit of join loops, they will hoist repeated, invariant calculations out of loops, re-phrase your arithmetic etc. etc.
In short, they are very, very clever. And it does not pay to second guess what your compiler will do. It is sensible to:
- Use all the appropriate compiler flags you can think of (see e.g. https://www.acrc.bris.ac.uk/pdf/compiler-flags.pdf) to make your code run faster, but also to:
- Use a profiler to determine which parts of your executable code (i.e. post compiler transformation) are taking the most time.
That way, you can target any improvement efforts on areas that will make a difference!
Exploitation of Modern Processor Architectures
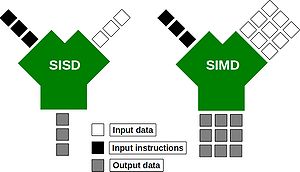
Just like the compilers described above. Modern processors are complex beasts! Over recent years, they have been evolving so as to provide more number crunching capacity, without using more electricity. One way in which they can do this is through the use of wide registers and the so-called SIMD (Single Instruction, Multiple Data) execution model:
Wide-registers allow several data items of the same type to be stored, and more importantly, processed together. In this way, a modern SIMD processor may be able to operate on 4 double-precision floating point numbers concurrently. What this means for you as a programmer, is that if you phrase your loops appropriately, you may be able to perform several of your loop interactions at the same time. Possibly saving you a big chunk of time.
Suitably instructed (often -O3 is sufficient), those clever-clog compilers will be able to spot areas of code that can be run using those wide registers. The process is called vectorisation. Today's compilers can, for example, vectorise loops with independent iterations (i.e. no data dependencies from one iteration to the next). You should also avoid aliased pointers (or those that cannot be unambiguously identified as un-aliased).
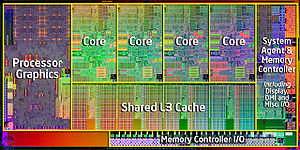
Modern processors have also evolved to have several (soon to be many!) CPU cores on the same chip:
Many cores means that we can invoke many threads or processes, all working within the same, shared memory space. Don't forget, however, that if these cores are not making the best use of the memory hierarchy, or there own internal wide-registers, you will not be operating anywhere near the full machine capacity. So you are well advised to consider the above topics before racing off to write parallel code.
Tools for Measuring Performance
OK, let's survey the territory of tools to help you profile your programs.
time
First off, let's consider the humble time command. This is a good tool for determining exactly how long a program takes to run. For example, I can time a simple Unix find command (which looks for all the files called README in the current and any sub-directories):
time find . -name "README" -print
The output (after a list of all the matching files that it found) was:
real	0m16.080s
user	0m0.248s
sys	0m0.716s
The 3 lines of output tell us:
- real: is the elapsed time (as read from a wall clock),
- user: is the CPU time used by my process, and
- sys: is the CPU time used by the system on behalf of my process.
Interestingly, in addition to just the total run time, find has also given us some indication of where the time is being spent. In this case, the CPU is very low compared to the elapsed time, as the process has spent the vast majority of time waiting for reads from disk.
gprof
Next up, the venerable gprof. This allows us to step up to a proper profiler. First, we must compiler our code with a suitable flag, -pg for the GNU (and many other) compilers. (We'll see what the other flags do later on.)
gcc -O3 -ffast-math -pg d2q9-bgk.c -o d2q9-bgk.exe
Once compiled, we can run our program normally:
./d2q9-bgk.exe
A file called gmon.out will be created as a side-effect. (Note also that the run-time of your program may be significantly longer when compiled with the -pg flag). We can interrogate the profile information by running:
gprof d2q9-bgk.exe gmon.out | less
This will give us a breakdown of the functions within the program (ranked as a fraction of their parent function's runtime).
Flat profile:

Each sample counts as 0.01 seconds.
  %   cumulative   self              self     total
 time   seconds   seconds    calls  ms/call  ms/call  name
 49.08     31.69    31.69    10000     3.17     3.17  collision
 33.87     53.56    21.87    10000     2.19     2.19  propagate
 17.13     64.62    11.06                             main
  0.00     64.62     0.00        1     0.00     0.00  initialise
  0.00     64.62     0.00        1     0.00     0.00  write_values
gprof is an excellent program, but suffers the limitation of only being able to profile serial code (i.e. you cannot use gprof with threaded code, or code that spawns parallel, distributed memory processes).
TAU
Enter TAU, another excellent profiler (from the CS department of Oregon University: http://www.cs.uoregon.edu/research/tau/home.php). The benefits that TAU has to offer include the ability to profile threaded and MPI codes. There are several modules to choose from on bluecrystal.
On BCp1:
> module av tools/tau
tools/tau-2.21.1-intel-mpi
tools/tau-2.21.1-openmp
tools/tau-2.21.1-mpi
On BCp2:
> module add profile/tau
profile/tau-2.19.2-intel-openmp
profile/tau-2.19.2-pgi-mpi
profile/tau-2.19.2-pgi-openmp
profile/tau-2.21.1-intel-mpi
For example, let's add the version of TAU on BCp2 that will use the Intel compiler and can profile threaded code:
> module add profile/tau-2.19.2-intel-openmp
Once I have it the module loaded, I can compile some C code using the special compiler wrapper script, tau_cc.sh:
tau_cc.sh -O3 d2q9-bgk.c -o d2q9-bgk.exe
Much like gprof, appropriately instrumented code will write out profile information as a side-effect (again you're program will likely be slowed as a consequence), which we can read using the supplied pprof tool
> pprof
Reading Profile files in profile.*

NODE 0;CONTEXT 0;THREAD 0:
---------------------------------------------------------------------------------------
%Time    Exclusive    Inclusive       #Call      #Subrs  Inclusive Name
              msec   total msec                          usec/call
---------------------------------------------------------------------------------------
100.0           21     2:00.461           1       20004  120461128 int main(int, char **) C
 91.5           58     1:50.231       10000       40000      11023 int timestep(const t_param, t_speed *, t_speed *, int *) C
 70.8     1:25.276     1:25.276       10000           0       8528 int collision(const t_param, t_speed *, t_speed *, int *) C
 19.8       23,846       23,846       10000           0       2385 int propagate(const t_param, t_speed *, t_speed *) C
  8.3       10,045       10,045       10001           0       1004 double av_velocity(const t_param, t_speed *, int *) C
  0.8        1,016        1,016       10000           0        102 int rebound(const t_param, t_speed *, t_speed *, int *) C
  0.1          143          143           1           0     143754 int write_values(const t_param, t_speed *, int *, double *) C
  0.0           34           34       10000           0          3 int accelerate_flow(const t_param, t_speed *, int *) C
  0.0           18           18           1           0      18238 int initialise(t_param *, t_speed **, t_speed **, int **, double **) C
  0.0        0.652        0.652           1           0        652 int finalise(const t_param *, t_speed **, t_speed **, int **, double **) C
  0.0        0.002        0.572           1           1        572 double calc_reynolds(const t_param, t_speed *, int *) C
To view the results of running an instrumented, threaded program we again use pprof, and are presented with profiles for each thread and an average of all threads:
[ggdagw@bigblue2 example2]$ pprof
Reading Profile files in profile.*

NODE 0;CONTEXT 0;THREAD 0:
---------------------------------------------------------------------------------------
%Time    Exclusive    Inclusive       #Call      #Subrs  Inclusive Name
              msec   total msec                          usec/call
---------------------------------------------------------------------------------------
100.0        0.077           94           1           1      94201 int main(void) C
 99.9        0.042           94           1           1      94124 parallel fork/join [OpenMP]
 99.9           94           94           4           3      23520 parallelfor [OpenMP location: file:reduction_pi.chk.c <26, 30>]
 99.3        0.001           93           1           1      93565 parallel begin/end [OpenMP]
 99.3            0           93           1           1      93546 for enter/exit [OpenMP]
  2.6        0.002            2           1           1       2404 barrier enter/exit [OpenMP]

NODE 0;CONTEXT 0;THREAD 1:
---------------------------------------------------------------------------------------
%Time    Exclusive    Inclusive       #Call      #Subrs  Inclusive Name
              msec   total msec                          usec/call
---------------------------------------------------------------------------------------
100.0            0           93           1           1      93047 .TAU application
100.0        0.001           93           1           1      93047 parallel begin/end [OpenMP]
100.0           93           93           3           2      31015 parallelfor [OpenMP location: file:reduction_pi.chk.c <26, 30>]
100.0        0.001           93           1           1      93045 for enter/exit [OpenMP]
  2.4        0.005            2           1           1       2214 barrier enter/exit [OpenMP]

NODE 0;CONTEXT 0;THREAD 2:
---------------------------------------------------------------------------------------
%Time    Exclusive    Inclusive       #Call      #Subrs  Inclusive Name
              msec   total msec                          usec/call
---------------------------------------------------------------------------------------
100.0            0           92           1           1      92069 .TAU application
100.0        0.001           92           1           1      92069 parallel begin/end [OpenMP]
100.0           92           92           3           2      30689 parallelfor [OpenMP location: file:reduction_pi.chk.c <26, 30>]
100.0        0.001           92           1           1      92067 for enter/exit [OpenMP]
  0.0        0.004        0.011           1           1         11 barrier enter/exit [OpenMP]

NODE 0;CONTEXT 0;THREAD 3:
---------------------------------------------------------------------------------------
%Time    Exclusive    Inclusive       #Call      #Subrs  Inclusive Name
              msec   total msec                          usec/call
---------------------------------------------------------------------------------------
100.0            0           92           1           1      92947 .TAU application
100.0        0.001           92           1           1      92947 parallel begin/end [OpenMP]
100.0           92           92           3           2      30982 parallelfor [OpenMP location: file:reduction_pi.chk.c <26, 30>]
100.0        0.001           92           1           1      92945 for enter/exit [OpenMP]
  1.9        0.002            1           1           1       1783 barrier enter/exit [OpenMP]

FUNCTION SUMMARY (total):
---------------------------------------------------------------------------------------
%Time    Exclusive    Inclusive       #Call      #Subrs  Inclusive Name
              msec   total msec                          usec/call
---------------------------------------------------------------------------------------
100.0          372          372          13           9      28626 parallelfor [OpenMP location: file:reduction_pi.chk.c <26, 30>]
 99.8        0.004          371           4           4      92907 parallel begin/end [OpenMP]
 99.8        0.003          371           4           4      92901 for enter/exit [OpenMP]
 74.7            0          278           3           3      92688 .TAU application
 25.3        0.077           94           1           1      94201 int main(void) C
 25.3        0.042           94           1           1      94124 parallel fork/join [OpenMP]
  1.7        0.013            6           4           4       1603 barrier enter/exit [OpenMP]

FUNCTION SUMMARY (mean):
---------------------------------------------------------------------------------------
%Time    Exclusive    Inclusive       #Call      #Subrs  Inclusive Name
              msec   total msec                          usec/call
---------------------------------------------------------------------------------------
100.0           93           93        3.25        2.25      28626 parallelfor [OpenMP location: file:reduction_pi.chk.c <26, 30>]
 99.8        0.001           92           1           1      92907 parallel begin/end [OpenMP]
 99.8      0.00075           92           1           1      92901 for enter/exit [OpenMP]
 74.7            0           69        0.75        0.75      92688 .TAU application
 25.3       0.0192           23        0.25        0.25      94201 int main(void) C
 25.3       0.0105           23        0.25        0.25      94124 parallel fork/join [OpenMP]
  1.7      0.00325            1           1           1       1603 barrier enter/exit [OpenMP]
perfExpert
If you are fortunate to be working on a Linux system with kernel version 2.6.32 (or newer), you can make use of perfExpert (from the Texas Advanced Computing Center, http://www.tacc.utexas.edu/perfexpert/quick-start-guide/). This gives us convenient access to a profile of cache use within our program.
A sample program is given on the TACC website. The code is below (I increased the value of n from 600 to 1000, so that the resulting example would show many L2 cache misses on my desktop machine):
source.c:
#include <stdlib.h>
#include <stdio.h>
#define n 1000

static double a[n][n], b[n][n], c[n][n];

void compute()
{
  register int i, j, k;
  for (i = 0; i < n; i++) {
    for (j = 0; j < n; j++) {
      for (k = 0; k < n; k++) {
        c[i][j] += a[i][k] * b[k][j];
      }
    }
  }
}

int main(int argc, char *argv[])
{
  register int i, j, k;

  for (i = 0; i < n; i++) {
    for (j = 0; j < n; j++) {
      a[i][j] = i+j;
      b[i][j] = i-j;
      c[i][j] = 0;
    }
  }

  compute();
  printf("%.1lf\n", c[3][3]);

  return 0;
}
We can compile the code in the normal way:
gcc -O3 source.c -o source.exe
Next, we run the resulting executable through the perfexpert_run_exp tool, so as to collate statistics from several trial runs:
perfexpert_run_exp ./source.exe
Now, we can read the profile data using the command:
perfexpert 0.1 ./experiment.xml
which in turn shows us the extent of the cache missing horrors:
gethin@gethin-desktop:~$ perfexpert 0.1 ./experiment.xml
Input file: "./experiment.xml"
Total running time for "./experiment.xml" is 5.227 sec

Function main() (100% of the total runtime)
===============================================================================
ratio to total instrns       %  0.........25...........50.........75........100
   - floating point      :    0 *
   - data accesses       :   38 ******************
* GFLOPS (% max)         :    0 *
   - packed              :    0 *
   - scalar              :    0 *
-------------------------------------------------------------------------------
performance assessment     LCPI good......okay......fair......poor......bad....
* overall                :  2.0 >>>>>>>>>>>>>>>>>>>>>>>>>>>>>>>>>>>>>>>
upper bound estimates
* data accesses          :  8.0 >>>>>>>>>>>>>>>>>>>>>>>>>>>>>>>>>>>>>>>>>>>>>>+
   - L1d hits            :  1.5 >>>>>>>>>>>>>>>>>>>>>>>>>>>>>>>
   - L2d hits            :  2.7 >>>>>>>>>>>>>>>>>>>>>>>>>>>>>>>>>>>>>>>>>>>>>>+
   - L2d misses          :  3.8 >>>>>>>>>>>>>>>>>>>>>>>>>>>>>>>>>>>>>>>>>>>>>>+
* instruction accesses   :  8.0 >>>>>>>>>>>>>>>>>>>>>>>>>>>>>>>>>>>>>>>>>>>>>>+
   - L1i hits            :  8.0 >>>>>>>>>>>>>>>>>>>>>>>>>>>>>>>>>>>>>>>>>>>>>>+
   - L2i hits            :  0.0 >
   - L2i misses          :  0.0 >
* data TLB               :  2.1 >>>>>>>>>>>>>>>>>>>>>>>>>>>>>>>>>>>>>>>>>>>
* instruction TLB        :  0.0 >
* branch instructions    :  0.1 >>
   - correctly predicted :  0.1 >>
   - mispredicted        :  0.0 >
* floating-point instr   :  0.0 >
   - fast FP instr       :  0.0 >
   - slow FP instr       :  0.0 >
Valgrind
Valgrind is an excellent open-source tool for debugging and profiling.
Compile your program as normal, adding in any optimisation flags that you desire, but also add the -g flag so that valgrind can report useful information such as line numbers etc. Then run it through the callgrind tool, embedded in valgrind:
valgrind --tool=callgrind your-program [program options]
When your program has run you find a file called callgrind.out.xxxx in the current directory, where xxxx is replaced with a number (the process ID of the command you have just executed).
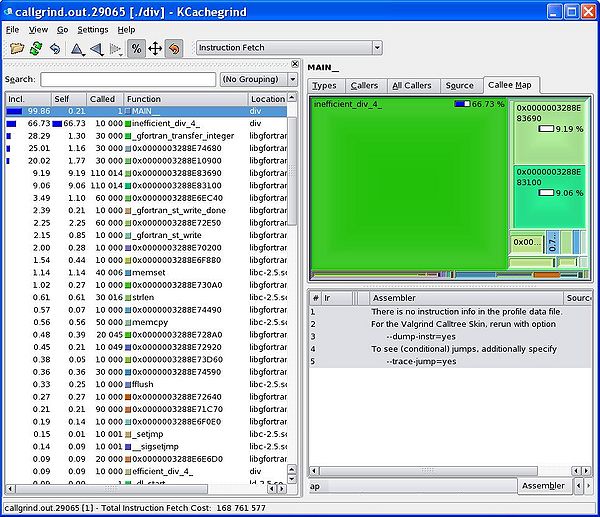
You can inspect the contents of this newly created file using a graphical display too call kcachegrind:
kcachegrind callgrind.out.xxxx
(For those using Enterprise Linux, you call install valgrind and kcachegrind using yum install kdesdk valgrind.)
A Simple Example
svn co https://svn.ggy.bris.ac.uk/subversion-open/profiling/trunk ./profiling
cd profiling/examples/example1
make
valgrind --tool=callgrind ./div.exe >& div.out
kcachegrind callgrind.out.xxxx
We can see from the graphical display given by kcachegrind that our inefficient division routine takes far more of the runtime that our efficient routine. Using this kind of information, we can focus our re-engineering efforts on the slower parts of our program.
The Matlab Profiler
- See http://www.mathworks.co.uk/help/matlab/ref/profile.html
- See also tic, toc timing: http://www.mathworks.co.uk/help/matlab/ref/tic.html
The Python Profiler
- http://www.huyng.com/posts/python-performance-analysis/
- http://www.appneta.com/2012/05/21/profiling-python-performance-lineprof-statprof-cprofile/
OK, but how do I make my code run faster?
OK, let's assume that we've located a region of our program that is taking a long time. So far so good, but how can we address that? There are--of course--a great many reasons why some code may take a long time to run. One reason could be just that it has a lot to do! Let's assume, however, that the code can be made to run faster by applying a little more of the old grey matter. With this in mind, let's consider a few common examples of code which can tweaked to run faster.
Compiler Options
You probably want to make sure that you've added all the go-faster flags that are available before you embark on any profiling. Activating optimisations for speed can make your progam run a lot faster!
As mentioned earlier, see e.g. https://www.acrc.bris.ac.uk/pdf/compiler-flags.pdf, for tips on which options to choose.
For this section, I'll use a fairly simple implementation of a Lattice Boltzmann fluid simulation. The general class of this algorithm--a time-stepped stencil mapped over a regular grid of cells--is not uncommon in science.
First of all, we'll compile the code with no additional flags:
gcc d2q9-bgk.c -o d2q9-bgk.exe
An run it using the time command:
time ./d2q9-bgk.exe
Here we see that the user's CPU time closely matches the elapsed time (good, no waiting for disk etc.) but that overall the program took over four minutes to run. Can we improve on this?
real	4m34.214s
user	4m34.111s
sys	0m0.007s
Let's ask the compiler to optimise the transform of our source code for speed, by adding in the -O3 flag:
gcc -O3 d2q9-bgk.c -o d2q9-bgk.exe
and time the execution...
real	2m1.333s
user	2m1.243s
sys	0m0.011s
Wow! that's more than twice as fast, just by typing three extra characters on the compile line.
Can we do better still? If you are willing and able to sacrifice some of the mathematical accuracy of your program, you can add in the -ffast-math flag:
gcc -O3 -ffast-math d2q9-bgk.c -o d2q9-bgk.exe
and time it...
real	1m9.068s
user	1m8.856s
sys	0m0.012s
Almost twice as fast again! So we have gained almost a 4x speed-up just through the judicious application of compiler flags--no code changes required at all.
Heed the Memory Hierarchy
- Avoid touching files on the disk, e.g. 'lock files'.
A Common Situation Involoving (Fortran) Loops
For our first example, consider the way we loop over the contents of a 2-dimensional array--a pretty common situation!. Skip over a directory and compile the example programs:
cd ../example2
make
In this directory, we have two almost identical programs. Compare the contents of loopingA.f90 and loopingB.f90. You will see that inside each program a 2-dimensional array is declared and two nested loops are used to visit each of the cells of the array in turn (and an arithmetic value is dropped in). The only way in which the two programs differ is the order in which the cycle through the contents of the arrays. In loopingA.f90, the outer loop is over the columns of the array and the inner loop is over the rows (i.e. for a given value of ii, all values of jj and cycled over). The opposite is true for loopingB.f90.
Let's compare how long it takes these two programs to run. We can do this using the Linux time command:
time ./loopingA.exe
and now,
time ./loopingB.exe
Dude! loopingA.exe takes more than twice the time of loopingB.exe. What's the reason?
Well, Fortran stores it's 2-dimensional arrays in column-major order. Our 2-dimension array is actually stored in the computer memory as a 1-dimension array, where the cells in a given column are next to each other. For example, the array:
- [math]\displaystyle{ \begin{bmatrix} 1 & 2 & 3 \\ 4 & 5 & 6 \end{bmatrix} }[/math]
would actually be stored in memory as:
1 4 2 5 3 6
That means is that our outer loop should be over the columns, and our inner loop over the rows. Otherwise we would end up hopping all around the memory, which takes extra time, and explains why loopingA takes longer.
The opposite situation is true for the C programming language, which stores its 2-dimensional arrays in row-major order. You can type:
make testC
To run some equivalent C code examples.
Avoid Expensive Operations
- Large constructs in interpreted languages (such as R), especially loops. Calling functions will be fast, however.
- memory operations such as allocate in Fortran, or malloc in C
- sqrt, exp and log
- division and raising raising numbers to a power
Only then Consider Parallel Programming
Writing parallel code is a lot more difficult than writing serial code. Not necessarily because of the new constructs and syntax that you'll need, but because of all the extra pitfalls that exist. There are new bugs to look out for, such as false sharing and deadlock. There is also the potentially performance killing requirements for synchronisation and global operations. If we are to achieve any real benefits from going parallel, we may well need to completely re-design our algorithms so that our programs will scale and not fall foul of Amdahl's Law (http://en.wikipedia.org/wiki/Amdahl's_law).


