Difference between revisions of "Profiling"
| Line 116: | Line 116: | ||
(For those using Enterprise Linux, you call install valgrind and kcachegrind using '''yum install kdesdk valgrind'''.) | (For those using Enterprise Linux, you call install valgrind and kcachegrind using '''yum install kdesdk valgrind'''.) | ||
| − | = | + | =A Simple Example= |
<pre> | <pre> | ||
Revision as of 14:30, 19 July 2013
Can I speed up my program?
Introduction
Key Questions
- How long does my program take to run?
- Is there anything I can do to speed it up?
- Which parts of my program take up most of the execution time?
- Where should I focus my improvement efforts?
Factors which Impact on Performance
The Memory Hierarchy
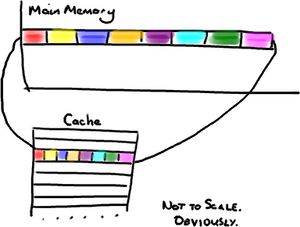
These days, it takes much more time to move some data from main memory to the processor, than it does to perform operations on that data. In order to combat this imbalance, computer designers have created several intermediate caches for data between the processor and main memory. These data stored at these staging posts may be accessed much more quickly than that in main memory. However, the trade-off is that the caches have much less storage capacity than main memory.
An analogy helps us appreciate the relative differences:
| L1 Cache | Picking up a book off your desk (~3s) |
| L2 Cache | Getting up and getting a book off a shelf (~15s) |
| Main Memory | Walking down the corridor to another room (several minutes) |
| Disk | Walking the coastline of Britain (about a year) |
Now, a program which is able to find the data it needs in cache will run much faster than one which regularly reads data from main memory, or worse still, disk.
Optimising Compilers
Exploitation of Modern Processor Architectures
Tools for Measuring Performance
gprof
TAU
On BCp1:
> module av tools/tau
tools/tau-2.21.1-intel-mpi
tools/tau-2.21.1-openmp
tools/tau-2.21.1-mpi
On BCp2:
> module add profile/tau
profile/tau-2.19.2-intel-openmp
profile/tau-2.19.2-pgi-mpi
profile/tau-2.19.2-pgi-openmp
profile/tau-2.21.1-intel-mpi
> module add profile/tau-2.19.2-intel-openmp
Want to compile some C code:
tau_cc.sh
> pprof profile.0.0.0
Reading Profile files in profile.*

NODE 0;CONTEXT 0;THREAD 0:
---------------------------------------------------------------------------------------
%Time    Exclusive    Inclusive       #Call      #Subrs  Inclusive Name
              msec   total msec                          usec/call
---------------------------------------------------------------------------------------
100.0           21     2:00.461           1       20004  120461128 int main(int, char **) C
 91.5           58     1:50.231       10000       40000      11023 int timestep(const t_param, t_speed *, t_speed *, int *) C
 70.8     1:25.276     1:25.276       10000           0       8528 int collision(const t_param, t_speed *, t_speed *, int *) C
 19.8       23,846       23,846       10000           0       2385 int propagate(const t_param, t_speed *, t_speed *) C
  8.3       10,045       10,045       10001           0       1004 double av_velocity(const t_param, t_speed *, int *) C
  0.8        1,016        1,016       10000           0        102 int rebound(const t_param, t_speed *, t_speed *, int *) C
  0.1          143          143           1           0     143754 int write_values(const t_param, t_speed *, int *, double *) C
  0.0           34           34       10000           0          3 int accelerate_flow(const t_param, t_speed *, int *) C
  0.0           18           18           1           0      18238 int initialise(t_param *, t_speed **, t_speed **, int **, double **) C
  0.0        0.652        0.652           1           0        652 int finalise(const t_param *, t_speed **, t_speed **, int **, double **) C
  0.0        0.002        0.572           1           1        572 double calc_reynolds(const t_param, t_speed *, int *) C
Valgrind
Valgrind is an excellent open-source tool for debugging and profiling.
Compile your program as normal, adding in any optimisation flags that you desire, but also add the -g flag so that valgrind can report useful information such as line numbers etc. Then run it through the callgrind tool, embedded in valgrind:
valgrind --tool=callgrind your-program [program options]
When your program has run you find a file called callgrind.out.xxxx in the current directory, where xxxx is replaced with a number (the process ID of the command you have just executed).
You can inspect the contents of this newly created file using a graphical display too call kcachegrind:
kcachegrind callgrind.out.xxxx
(For those using Enterprise Linux, you call install valgrind and kcachegrind using yum install kdesdk valgrind.)
A Simple Example
svn co https://svn.ggy.bris.ac.uk/subversion-open/profiling/trunk ./profiling
cd profiling/examples/example1
make
valgrind --tool=callgrind ./div.exe >& div.out
kcachegrind callgrind.out.xxxx
We can see from the graphical display given by kcachegrind that our inefficient division routine takes far more of the runtime that our efficient routine. Using this kind of information, we can focus our re-engineering efforts on the slower parts of our program.
OK, but how do I make my code run faster?
OK, let's assume that we've located a region of our program that is taking a long time. So far so good, but how can we address that? There are--of course--a great many reasons why some code may take a long time to run. One reason could be just that it has a lot to do! Let's assume, however, that the code can be made to run faster by applying a little more of the old grey matter. With this in mind, let's consider a few common examples of code which can tweaked to run faster.
Compiler Options
You probably want to make sure that you've added all the go-faster flags that are available before you embark on any profiling. Activating optimisations for speed can make your progam run a lot faster!
gcc d2q9-bgk.c -o d2q9-bgk.exe
time ./d2q9-bgk.exe
real	4m34.214s
user	4m34.111s
sys	0m0.007s
gcc -O3 d2q9-bgk.c -o d2q9-bgk.exe
real	2m1.333s
user	2m1.243s
sys	0m0.011s
gcc -O3 -ffast-math d2q9-bgk.c -o d2q9-bgk.exe
real	1m9.068s
user	1m8.856s
sys	0m0.012s
Scripting Languages
- Avoid loops, especially in interpreted languages (like R).
- tic, toc timings in matlab
- The python profiler.
A Common Situation Involoving Loops
For our first example, consider the way we loop over the contents of a 2-dimensional array--a pretty common situation!. Skip over a directory and compile the example programs:
cd ../example2
make
In this directory, we have two almost identical programs. Compare the contents of loopingA.f90 and loopingB.f90. You will see that inside each program a 2-dimensional array is declared and two nested loops are used to visit each of the cells of the array in turn (and an arithmetic value is dropped in). The only way in which the two programs differ is the order in which the cycle through the contents of the arrays. In loopingA.f90, the outer loop is over the columns of the array and the inner loop is over the rows (i.e. for a given value of ii, all values of jj and cycled over). The opposite is true for loopingB.f90.
Let's compare how long it takes these two programs to run. We can do this using the Linux time command:
time ./loopingA.exe
and now,
time ./loopingB.exe
Dude! loopingA.exe takes more than twice the time of loopingB.exe. What's the reason?
Well, Fortran stores it's 2-dimensional arrays in column-major order. Our 2-dimension array is actually stored in the computer memory as a 1-dimension array, where the cells in a given column are next to each other. For example, the array:
- [math]\displaystyle{ \begin{bmatrix} 1 & 2 & 3 \\ 4 & 5 & 6 \end{bmatrix} }[/math]
would actually be stored in memory as:
1 4 2 5 3 6
That means is that our outer loop should be over the columns, and our inner loop over the rows. Otherwise we would end up hopping all around the memory, which takes extra time, and explains why loopingA takes longer.
The opposite situation is true for the C programming language, which stores its 2-dimensional arrays in row-major order. You can type:
make testC
To run some equivalent C code examples.
Not Doing the Same Thing Twice (or more!)
The following is the Manning formula drawn from the field of hydrology:
- [math]\displaystyle{ V = \frac{1}{n} R_h ^\frac{2}{3} \cdot S^\frac{1}{2} }[/math]
where:
[math]\displaystyle{ V }[/math] is the cross-sectional average velocity (m/s) [math]\displaystyle{ n }[/math] is the Gauckler–Manning coefficient (independent of units) [math]\displaystyle{ R_h }[/math] is the hydraulic radius (m) [math]\displaystyle{ S }[/math] is the slope of the water surface or the linear hydraulic head loss (m/m) ([math]\displaystyle{ S=h_f/L }[/math])
A program to compute estimates of [math]\displaystyle{ V }[/math], given an array of N hydraulic radii may contain the following loop:
  do ii=1,N
     V(ii) = (1/n) * (R(n)**(2.0/3.0)) * sqrt(S)
  end do
However, this loop may be rather wasteful. For example, if the value for the Gauckler–Manning coefficient, [math]\displaystyle{ n }[/math] is the same for all the hydraulic radii, we would be computing (1/n) needlessly each time through the loop and could take it outside:
  n_inv = (1/n)

  do ii=1,N
     V(ii) = n_inv * (R(n)**(2.0/3.0)) * sqrt(S)
  end do
This would make particular sense, since the division operator is an expensive one. We also don't need to compute (2.0/3.0)) over and over:
  n_inv = (1/n)
  exponent=2.0/3.0

  do ii=1,N
     V(ii) = n_inv * (R(n)**exponent) * sqrt(S)
  end do
Lastly, if the slope of the water surface is constant, then the square-root in the loop is also superfluous:
  n_inv = (1/n)
  exponent=2.0/3.0
  root_S = sqrt(S)

  do ii=1,N
     V(ii) = n_inv * (R(n)**exponent) * root_S
  end do
Now, modern optimising compilers are getting better and better at spotting this sort of thing and may actually create machine code from the first example which is as if you had made all the subsequent improvements. This is partly why we profile our programs in the first place, as it is very difficult to second guess what the compiler will do with your source code.
With that as a caveat it is worth just briefly listing typically expensive operations (in terms of CPU cycles) which a profile may point you too and which you may be able to address through some programming tweaks:
- memory operations such as allocate in Fortran, or malloc in C
- sqrt, exp and log
- division and raising raising numbers to a power
It's difficult to make sweeping statements in the area of code optimisation, but it will certainly pay not to do the same thing twice (or more!), especially is that thing is a relatively expensive operation.
Compiler Optimisations
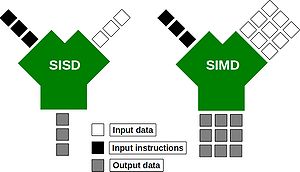
Once you have re-factored any portions of your code highlighted by profiling your program, you may like to take a few minutes to peruse all the command line options available on your compiler. A number of these will be aimed at execution speed. Those aimed at Streaming SIMD Extensions (SSE) can be particularly effective.
A caveat, however, is that you should be careful when invoking aggressive compiler optimisations since, under certain circumstances, they can change the values that your program will output. See, for example the numerics tutorial.


