Debugging
Debugging you program: Various techniques
Introduction
Humans can be ingenious, inspired, careful, persistent and many things besides. All of these character traits can be called upon when writing software. There is one aspect of human nature we can be certain of, however: We err. We make mistakes; break stuff; generally muck it up. No amount of technology or gizmos will change this. From time-to-time, we all get it wrong.
This isn't all bad, however. It's a cliche, but if we never made a mistake, how would be learn? Making mistakes is essential for progress. That said, we also need our programs to function correctly, or indeed work at all. We want our weather and climate models to accurately predict the future. We don't want our banking software to 'lose' our money. Computers are more and more forming the cogs of our daily lives, and we want them to do the job.
OK, enough of the philosophy. Since that we're going to get bugs which we don't want, this workshop is focussed upon finding them and correcting them--the art of debugging. Approached hurriedly or unprepared, debugging can be a torrid and despairing affair. With some good tools and an informed approach, however, debugging can be a rewarding task. As we alluded to earlier, debugging is a learning process and as you grapple with your own projects, you will have a great many of those, "aha!" and "oh, I see!" moments. Not quite a joy, perhaps, but definitely satisfying.
Getting the content for the practical
OK, let's make a start. Login to your favourite linux box and type:
svn co https://svn.ggy.bris.ac.uk/subversion-open/debugging/trunk ./debugging
A Common Bug: going beyond the boundaries of an array
We will start with a pretty common coding problem: we have an array and a loop which access elements of that array in turn. The problem is that we've made a mistake with our loop and it tries to access elements beyond the boundaries of our array.
Let's visit our example:
cd debugging/examples/example1
Here's the saliant parts of the code, from array_bounds.f90:
  integer, parameter :: n = 10  ! array size
  integer            :: ii      ! counter
  real, dimension(n) :: x       ! array
  ! a loop accessing beyond the array bounds
  do ii = 1, 10000
    x(ii) = x(ii) + real(ii)
    write (*,*) "x(",ii,") is: ", x(ii)
  end do
Let's take a look and compile up the code using the open-source gfortran compiler.
We get a segmentation fault as soon as we step outside of the array. "Fine, this is how it should be", you say. Well, somethimes were not so lucky. I tried compiling-up the same code using both the Intel and PGI Fortran compilers. We wern't so lucky. With Intel, the counter reached 44 before the program crashed. With PGI, we needed to step outside the array by thousands of elements before we triggered a segmentation fault.
Happily we can check for array bounds problems in a less ad hoc manner. Many compilers allow you to incorporate run-time array-bounds checks into your executable. Using g95, this is done by supplying the flag -fbounds-check (-CB for Intel, or -Mbounds for PGI). When we run the program now, we get a much more definitive statement from the compiler (and Intel and PGI don't wait until we're way passed the end of the array either):
Fortran runtime error: Array element out of bounds: 11 in (1:10), dim=1
So, by testing our code with the appropriate compiler flags, we can track down occurances of this common problem. See the section below called compiler Flags Again for a list of useful flags for common Fortran ompilers.
I've also added the code 2d_array_bounds.f90 to show what happens when we go beyond the limits of a 2d array. Try the code both with and without -fbounds-check.
Argument Mismatch
Another common bug is a mismatch between the number (or type) of arguments passed to a subroutine when it is called and those defined in the definition of the subroutine itself. Let's take a look at an example:
cd ../example2
In the file subroutines.f90, we have three subroutines. The calls and definitions for the first two match. However, the third is called in the main program using:
call sub3(numDim)
but defined as:
subroutine sub3(numDim,arg2)

  implicit none

  ! args
  integer, intent(in)  :: numDim
  integer, intent(out) :: arg2

  arg2 = numDim

end subroutine sub3
Now, you may think this is an obvious mistake, and it is for a small number of arguments. However, for large progams the argument lists for subroutines can get quite large. Perhaps 10, 20 even 30 arguments. When we get up to those numbers, it's very hard to spot a mismatch.
Sadly for us, compilers such as Intel and PGI don't check that the calls and the definitions match by default--it's not the Fortran way! They would compile up the program happily, only for it to seg' fault at runtime (with PGI or Intel):
 We live in             3  dimensions
 Up, down, side to side, yup             3  dimensions it is!
Segmentation fault
Using the gfortran compiler, we get an even worse situation, the executable runs, doesn't run correctly and doesn't seg' fault:
 We live in            3  dimensions
 Up, down, side to side, yup            3  dimensions it is!
 arg2 is:     -9306102 ..completely undefined!
What a pain! Happily, there is a very simple fix to all this--we place our subroutines into a Fortran90 module. Let's take a look at what happens this time:
cd ../example3
We have an (almost) identical main program (the use statement is the only addition) and we have hived-off all our subroutines into mymod.f90. This time when we try to compile, with PGI, we get:
PGF90-S-0186-Argument missing for formal argument arg2 (subroutines.f90: 15)
  0 inform,   0 warnings,   1 severes, 0 fatal for argmismatch
make: *** [subroutines.o] Error 2
with Intel:
fortcom: Error: subroutines.f90, line 15: A non-optional actual argument must be present when invoking a procedure with an explicit interface.   [ARG2]
  call sub3(numDim)
-------^
compilation aborted for subroutines.f90 (code 1)
or with gfortran:
 In file subroutines.f90:15

  call sub3(numDim)
                  1
Error: Missing actual argument for argument 'arg2' at (1)
We still have an error. This is true. But we are told exactly what and where it is and also before we've wasted a load of time trying to run the faulty program.
Enable All Warnings
It pays to get all the information you can from your compiler. By default, your compiler will stop with and error if it finds some code which is clearly wrong. It may also produce some warnings as it works through your code. These don't stop the compilation but do highlight questionable code. Not all warnings are output by defualt. Using gfortran, for example, we can request that we are warned of all the grey areas in our code, using -Wall (which stands for Warn all). Eliminating warnings is a great step towards eliminating bugs.
Other compilers:
- ifort: -warn all
- g95: -Wall
- SunStudio12 f90: (-w1) errors and warnings by default, -w4 for additional cautions, notes & comments
- pgf90: -Minform=inform will expand the range of warnings given over the default (-Minform=warn)
If you can't stomach all the warnings, there is a useful subset in section below Debugging#Compiler_flags_again.
Looking into the Program as it Runs!
So far, we've looked at some bugs with severe effects--they caused the program to crash. If we have a bug, in a way we hope it's one with severe effects. That way at least they will be easy to spot! So far these severe problems have been easy to track down too. Alas, bugs are often more subtle and are accordingly harder to find. Don't despair, however, as we have more tools and aids to help us find the pernicious little critters.
An oft seen approach is to add print statements to the code, perhaps printing the value of a variable or merely proclaiming, "the program got as far as me!" Then re-compile and re-run the program. Perhaps we get some insight or not on this time around, add some more print statements, re-compile, re-run and hopefully home-in on the problem. This approach can certainly work, but is tedious and time consuming. Happily there is a better way. We can run our code inside a tool specifically designed to help us find bugs--we can use a debugger.
A very serviceable open-source debugger available on most Linux systems is called DDD. We will use this one for this practical. There are a number of other good debugging tools, such as MS VisualStudio, the Portland Group debugger (available on quest) and many more besides. They all work in a similar manner, however, and so becoming familiar with DDD will keep you in good stead. We should also note that DDD works best with the gfortran compiler, so it is well worth using this rather good open-source compiler to create your programs.
OK, let's move to a new example:
cd ../example4
We can compile up our program using make, note, however, the addition of the -g flag to the (g95) compiler, which instruments the code for dubugging:
[ggdagw@dylan example4]$ make
gfortran -g -c gubbins.f90 -o gubbins.o
gfortran -g gubbins.o -o gubbins.exe
Note that we have included the -g flag in the link line, creating the executable. If you use any other debugging flags, such as -fbounds-check or -ffpe-trap=underflow,overflow,zero, you should include them on the link line too. We've also removed any optimisation flags, such as -O3, when compiling for debugging.
Now, the sorrowful program in gubbins.f90 is full of programming problems:
- integer division
- overflow
- underflow
- divide by zero
The program will typically run silently to completion (although see the section called Compiler Flags Again below for examples of when this is not the case) and we may be none the wiser about any of the mishaps along the way. However, if we run the program inside the debugger, we can examine the values of all the variables and control the flow of the program as we see fit, exposing all those little mistakes to the cold light of day:
ddd gubbins.exe
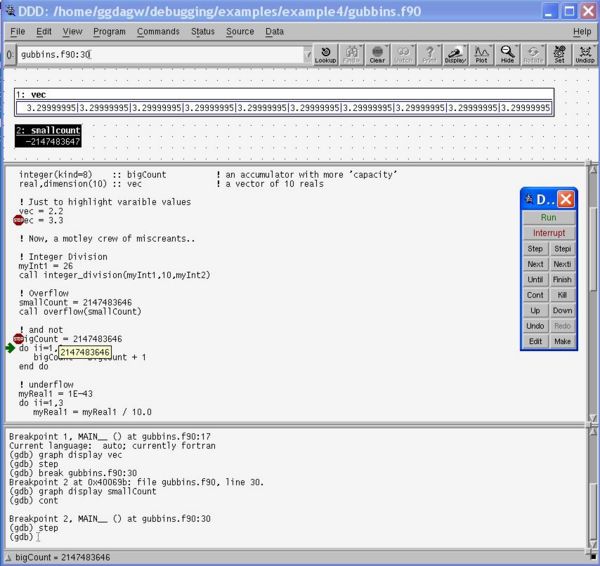
The first thing we do is to set a breakpoint. When we run the program, it will get as far as the line of code with the breakpoint attached, and will then sit and wait for our next command. We can step the program one line at a time. This will step-into subroutine calls. Use next to step the program, but step-over subroutine calls. We can continue to the next breakpoint (or the end of the program if we haven't set one) and also display the values of variables as we go along. You can also hover over variables to see their values, or right click and use print or display to watch the values of variables change as the program advances. This is all rather neat, eh?!
Inspecting the flow of loops and conditionals and the values of variables inside a program like this is ideal for finding bugs, and it's a lot less laborious than a tedious cycle of add print statement, re-compile, re-run...
If your program halts due to a bug, a useful command to type into the lower command window is where. This gives a backtrace of subroutine calls (and lines of files they were in) which led to the problem. Again, very handy.
Below is a screenshot of DDD in action, debugging gubbins.exe:
Data Visualisation for Debugging
When debugging, it can be very helpful to visualise the data held in the arrays in your program. This is especially true when looking for bugs in numerical routiunes. Happily, we can also do this using DDD:
cd ../example5
For this example, we have some code which will populate an array with values for the attractive looking function:
[math]\displaystyle{ sinc(x^2+y^2) = \frac{\sin(\sqrt{x^2+y^2})}{\sqrt{x^2+y^2}} }[/math]
First we must compile the code using make (note we are compiling with '-g'). Then we can start the debugger with the program loaded:
ddd sinc.exe
Now, before we plot the data held in the array z, we need to set 2 things:
- Go to Edit|Preferences|Helpers and switch plot window to external.
- In the command window (at the bottom of your DDD display) type set print elements 1000, and hit return.
DDD uses the GNU command-line debugger, GDB, under-the-hood. GDB has a default limit of 200 for the number of cells in a matrix that it will print. We need to expand this to handle our 20x20 array, and I've chosen 1000 to give us plenty of room.
We're now in a position to plot our data. Set a breakpoint at line 29 of sinc.f90:
  ! print the z array as a matrix
  ! redirect to a file, 'foo.dat' and load into gnuplot
  ! using: splot 'foo.dat' matrix with lines
  do xx=-n/2,n/2
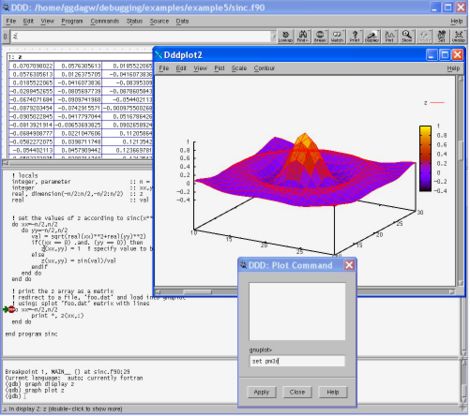
Then click run. When the program is at the breakpoint, click on z and then the plot button on the toolbar. You will be rewarded with a 3d plot of points for out sinc function. You can make this easier to see by clicking on the plot menu in the new window and selecting lines. Lovely!
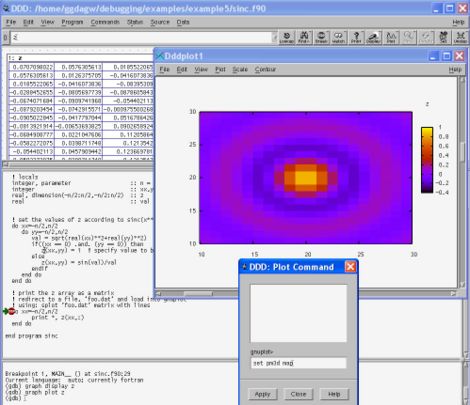
Even better, go to File|Command and you will get an interactive command window with GNUplot, the plotting package that DDD is calling upon as a helper. Type set pm3d into the command window and click Apply. Now we're talking! If you would like a 2d representation of the data, but with colours coding for cell values, type set pm3d map and click Apply again. Et voila!
Debugging Fortran90 Data Structures
Previously, GDB was not able to interpret Fortran90 features such as allocatable arrays and derived types. This was a pain and meant that in order to fully debug Fortran90 programs, we had to jump through some hoops to enable DDD to use, for example, the Intel debugger IDB. This is no longer the case for some newer Linux distributions, such as CentOS 5.4, as here GDB has been patched and works--out-of-the-box--with Fortran90.
If you would like some example Fortran90 code:
cd ../example6
If you look inside the Makefile, you'll notice that we are compiling using the Intel compiler ifort this time. In order to try this example, you must ensure that you have access to both the Intel compiler, and the debugger, idb. On eocene you can do this using the module commnand:
module add intel/fc/10.1.015
module add intel/idb/10.1.015
You can build the program using make. To start the debugger, type:
ddd --gdb --debugger idb
(In the above command, we are telling DDD to use IDB as the core dubugger and further that it behaves like GDB.)
Once DDD have started, open the program by following the menu File|Open Program and select user-types.exe. If you place a break point at line 47 (Source|Display Line Numbers) and run the program, you will be able to right-click the variable stations and choose Display stations). You will need to right-click the stations object in the data window and select Show All. Then you will be able to see all the members of the allocatable array of user-defined types.
Using Emacs as a Debugger
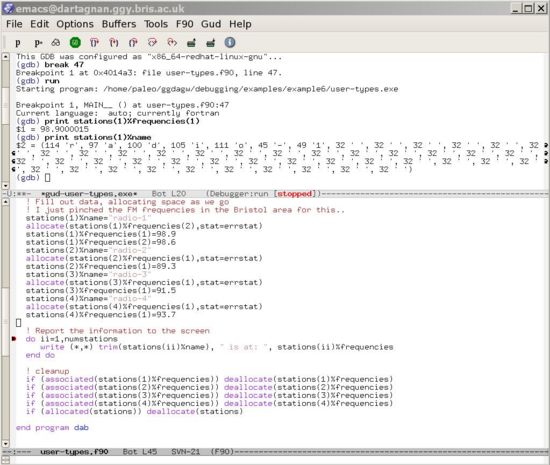
You can run a debugging session through your emacs window, if you like.
Using emacs, you can step through your code, display the values of variables etc. in a very similar way to using DDD.
Defensive Programming
Note that accidentally modifying an argument passed to a subroutine is another common source of problems. The best way to address this one is an example of defensive programming, whereby we proactively avoid bugs through mindful programming practices. Fortran provides us with the intent attribute for dummy variables to address this. Trying to modify a dummy variable with the intent(in) attribute will result in a compile-time error. Adding intent to your arguments also helps you think clearly about the design of your subroutine.
Compiler flags again
Although running you program through a debugger is the most comprehensive way of examining problems, compiler flags an come to our aid again for some special cases.
You an try, for example, compiling gubbins.exe from example4 again using the various floating point exception flags from below:
- gfortran:
- selected warnings: -Wuninitialized
- array-bounds: -fbounds-check
- floating point exceptions: -ffpe-trap=underflow,overflow,zero
- 'saving' local variables: -fno-automatic
- g95:
- selected warnings: -Wuninitialized, -Wprecision-loss
- stack-trace reporting: -ftrace=full
- array-bounds: -fbounds-check
- floating point exceptions: set one or more of the environment variables (export VAR=VAL in BASH):
- export G95_FPU_ZERODIV=t
- export G95_FPU_UNDERFLOW=t
- export G95_FPU_OVERFLOW=t
- export G95_FPU_INVALID=t
- 'saving' local variables: -fstatic
- SunStudio12 f90:
- array-bounds: -C
- floating point exceptions: -ftrap=common (this is on by default)
- pgf90:
- array-bounds: -Mbounds
- 'saving' local variables: -Msave
- ifort:
- stack-trace reporting: -traceback
- array-bounds: -CB
- report variables which are used but not initialised: -CU
- floating point exceptions: -fpe0 -fpstkchk
There are a wealth of useful options in the manual pages!
Note that some legacy Fortran code assumes that the value of a variable in a subroutine or function will be retained from one call to the next. This is in contrast to the assumptions of modern programs, where they may be explicitly given the save attribute if this behaviour is required. A compiler flag may be available to 'save' the variables of a program en masse.
Memory Leaks
cd ../example7
make
Fortran
Must compile using g95:
./memory-leak.exe
Remember 4-byte reals, [math]\displaystyle{ 50,000 \times 4 = 200,000 }[/math]
If you don't have g95:
valgrind --tool=memcheck --leak-check=yes ./memory-leak.exe
gives, e.g.
...
==20228== HEAP SUMMARY:
==20228==     in use at exit: 6,000,000 bytes in 3 blocks
==20228==   total heap usage: 9 allocs, 6 frees, 6,025,632 bytes allocated
==20228==
==20228== 2,000,000 bytes in 1 blocks are possibly lost in loss record 1 of 2
==20228==    at 0x4A05E1C: malloc (vg_replace_malloc.c:195)
==20228==    by 0x307EC1134C: ??? (in /usr/lib64/libgfortran.so.1.0.0)
==20228==    by 0x4006CF: MAIN__ (memory-leak.f90:15)
==20228==    by 0x40076D: main (in /home/paleo/ggdagw/debugging/examples/example7/memory-leak.exe)
==20228==
==20228== 4,000,000 bytes in 2 blocks are definitely lost in loss record 2 of 2
==20228==    at 0x4A05E1C: malloc (vg_replace_malloc.c:195)
==20228==    by 0x307EC1134C: ??? (in /usr/lib64/libgfortran.so.1.0.0)
==20228==    by 0x4006CF: MAIN__ (memory-leak.f90:15)
==20228==    by 0x40076D: main (in /home/paleo/ggdagw/debugging/examples/example7/memory-leak.exe)
==20228==
==20228== LEAK SUMMARY:
==20228==    definitely lost: 4,000,000 bytes in 2 blocks
==20228==    indirectly lost: 0 bytes in 0 blocks
==20228==      possibly lost: 2,000,000 bytes in 1 blocks
==20228==    still reachable: 0 bytes in 0 blocks
==20228==         suppressed: 0 bytes in 0 blocks
==20228==
==20228== For counts of detected and suppressed errors, rerun with: -v
==20228== ERROR SUMMARY: 2 errors from 2 contexts (suppressed: 4 from 4)
C/C++
Testing
In the previous sections we've looked at a number of ways of finding a bug once we know we have a problem. The fix for a bug is usually self-evident, and part of the "aha!" moment. However, in order to determine whether or not we are harbouring a bug, or more accurately, whether it is manifest under the range of conditions in which we run our program, we need to test it. This may seem blindingly obvious, but it is sobering to see the number of programs that are used without a second thought given to testing whether it actually does what it is intended to do!
There are few generalities that we can list with regard to testing--different codes are likely to be have rather different needs. However, I can would stress that it is a good idea to make it as easy as possible to test your code. Frequent testing is the key to finding bugs quickly and those that are found in a timely manner and far easier to find and fix (1).
It is possible to add a test rule to a makefile that you use to compile your code. Given such a rule and some appropriate scripts, it can be as simple as typing make test to test your code. Easy for you. Easy for your collaborators. Easier to find and fix the bugs. To find out more about make and the addition of a test rule, take a look at our course on make.
To go further
The Pragmatic Programming continues with a pratical about using version control with subversion at the command line: subversion.
References
- Kaner, Cem; James Bach, Bret Pettichord (2001). Lessons Learned in Software Testing: A Context-Driven Approach. Wiley, 4. ISBN 0-471-08112-4.
Appendix A
Segmentation Faults and Operating System Limits
If you get a Segmentation fault error without any further information, despite requesting stack trace information etc., this could be due to hitting an operating system limit regarding the amount of memory your program can allocate. Assuming you are using Linux, try using the ulimit -a command. If you are using large large, statically allocated arrays, you could try increasing the stack size, using the ulimit -s command. (The stack size limit exists to guard against runaway recusive processes.)


